The impact of phosphorus stripping at Chesham Sewage Treatment Works on water quality and ecology in the Chess
Phosphate is one of the biggest problems for the River Chess. In the Environment Agency’s Water Framework Directive assessment, phosphate status is rated as ‘Poor’ and a key ‘Reason for Not Achieving Good status’ limiting the Chess to its current overall rating of ‘Moderate’.
One of the greatest phosphate sources was the Chesham Sewage Treatment Works (STW), so the EA reduced its phosphorus permit limit from 2.0 mg/l to 0.25 mg/l P. Thames Water upgraded the STW with the installation of phosphorus stripping, which was installed in December 2024. As you can see in the below graphs (figures 1 and 2), this has been very successful in reducing total phosphorus in treated effluent.
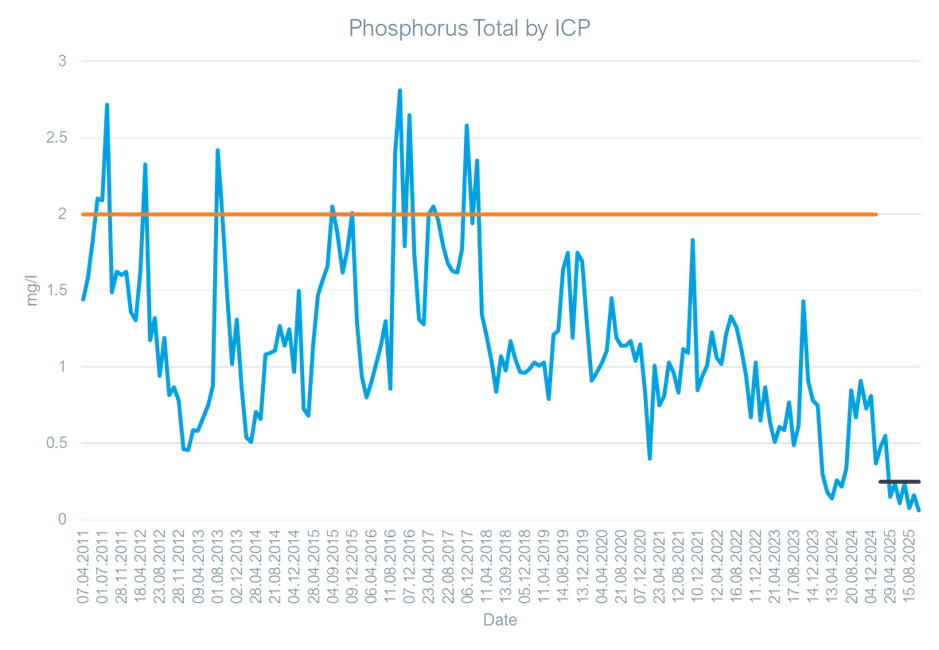
Figure 1 – Total phosphorus measured at discharge point from Chesham STW 2011-2025. Credit: Rosie Nelson, Thames Water
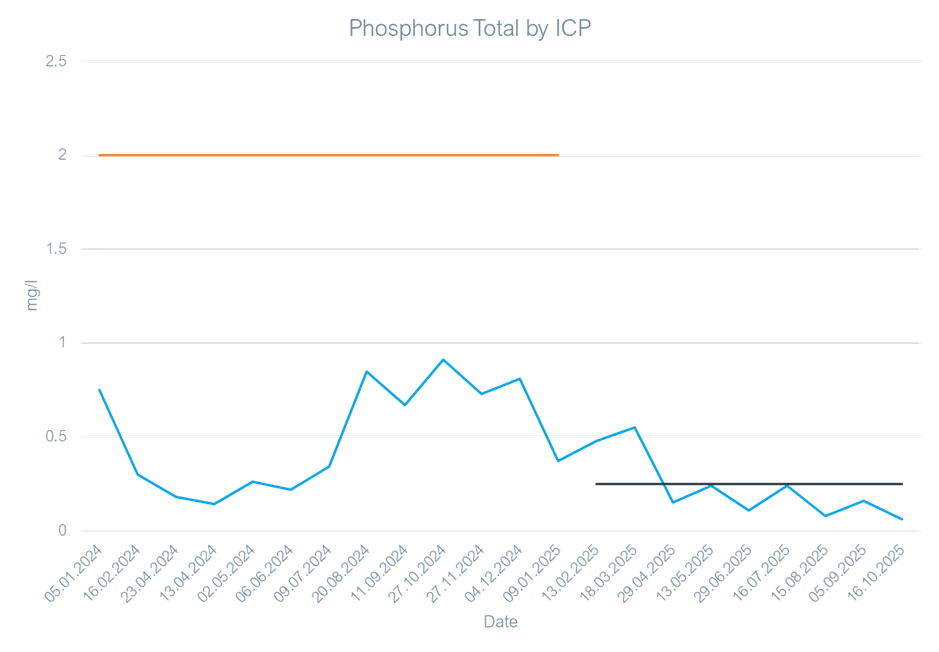
Figure 2 – Total phosphorus measured at discharge point from Chesham STW 2024-2025. Credit: Rosie Nelson, Thames Water
One year after the phosphorus stripping was activated, we have assessed the initial impacts of this work on the wider river….
NOSES RESULTS
In October we ran two ‘Nutrient Ongoing Scrutiny Evaluation Survey’ AKA NOSES days to investigate phosphate levels in the Chess. NOSES is a citizen science survey that involves volunteers collecting samples, which we then test using Hanna nitrate photometers, giving us a high spatial resolution snapshot of phosphate.
At Restore Hope Latimer we compared phosphate levels in the Main Chess which has effluent from Chesham STW, and the Little Chess which has no STW input so is a ‘clean’ spatial comparison see Figure 3. As displayed in Figure 4 phosphate levels in the main Chess are now similar to background levels in the Little Chess. Whilst the Little Chess has some lower values there was not a statistically significant difference between the Chess and Little Chess (Welch’s T-Test: t-statistic = -1.8240, p-value = 0.0997).
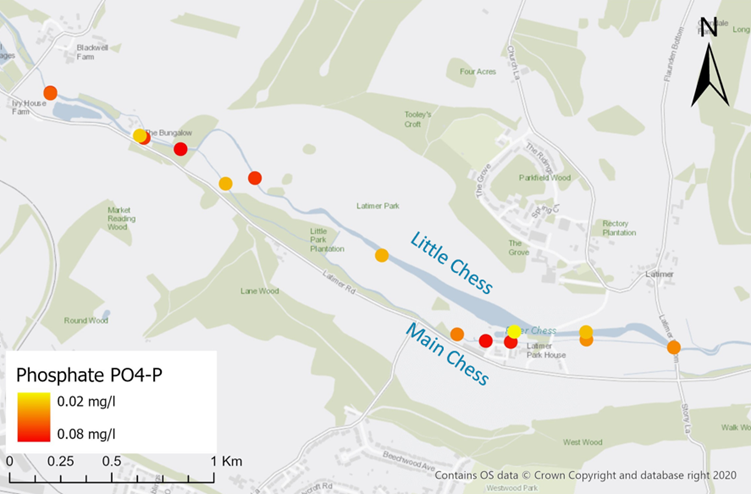
Figure 3 – Map of mean phosphate levels recorded on the Little Chess and Main Chess during the October 2025 NOSES survey. Credit: Iona McMillan, Chilterns Chalk Streams Project
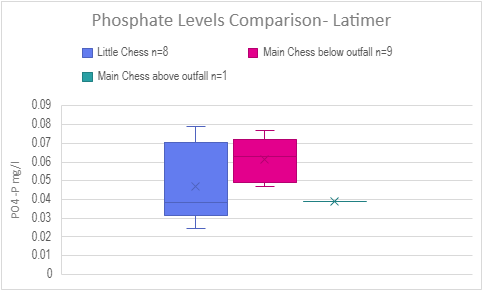
Figure 4 – Box chart showing the range of mean phosphate levels on Main Chess and Little Chess recorded in October 2025 NOSES surveys. Credit: Iona McMillan, Chilterns Chalk Streams Project
At Chorleywood we repeated sample locations first surveyed in 2023, with the interannual comparison shown in fig.5. The 2025 results were statistically significantly lower than the 2023 results (Welch’s t-test, t-statistic = -4.3680, p-value = 0.0005).
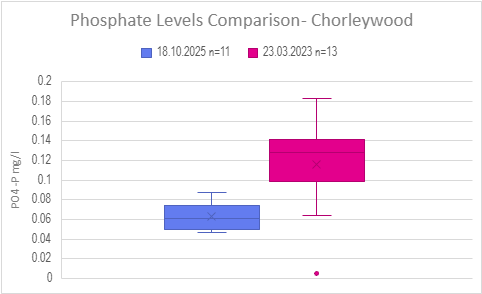
Figure 5 – Box chart showing the range of mean phosphate levels recorded at the same locations in Chorleywood in March 2023 and October 2025 NOSES surveys. Credit: Iona McMillan, Chilterns Chalk Streams Project
Combined this suggests that the phosphorus stripping has caused a reduction in phosphate levels in the Chess towards background levels.
LONG-TERM DATA
As NOSES are one off point samples, we also looked at longterm datasets collected with our partners, which confirmed the trend of reduced phosphate levels.
Queen Mary University London are our partners in the ChessWatch project including our water quality sondes. When we maintain the sondes each month, we also collect a variety of data including flow monitoring, level gauges, and spot samples of water quality. This data is frequently used by their students in dissertations.
QMUL began collecting monthly phosphate samples from one year before the phosphorus stripping was put in place, to track the resulting change. The data is still being used in student research so cannot be published yet, but it shows a distinct reduction of ~90% in phosphate levels downstream of the STW in 2025 compared to 2024. Whilst phosphate levels can be affected by precipitation, this drop in phosphates was marked even before the decline in rainfall.
The Floods and Droughts Research Infrastructure project also collected weekly phosphate samples from September 2024 to March 2025. There was also a clear step change after the phosphorus stripping, displayed in Figures 6 and 7. In December 2024 just before the phosphorus stripping there was a phosphate peak: downstream of the STW peaked about 600µg/L total phosphorus, double the upstream peak of 300µg/L. After the phosphorus stripping was activated, phosphate levels downstream dropped to 100µg/L total phosphorus matching the upstream levels.
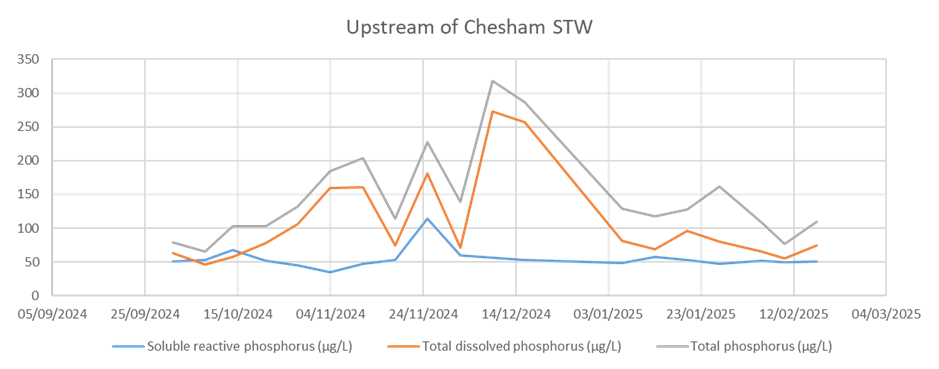
Figure 6 – Credit: Floods and Droughts Research Institute. Data provided by Mike Bowes, CEH
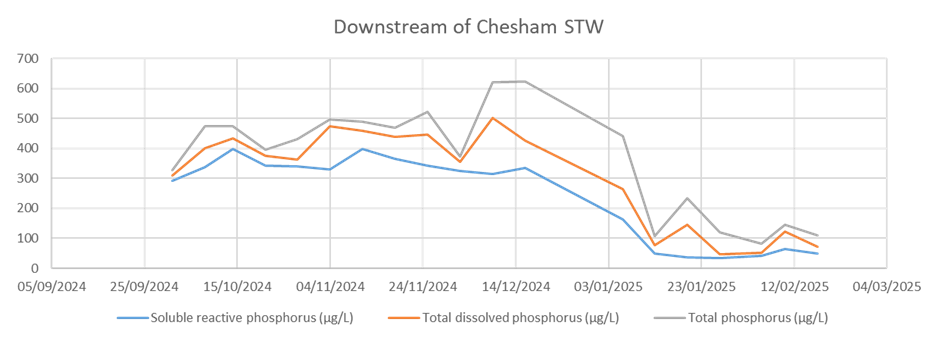
Figure 7 – Credit: Floods and Droughts Research Institute. Data provided by Mike Bowes, CEH
SMARTRIVERS
SmartRivers is a national citizen science scheme run by WildFish. It involves kick sampling for aquatic invertebrates, and laboratory identification and analysis. As species have different sensitivities to stressors, this data is put through metrics to measure different pressures. Usefully for this investigation, one of the stressor indices that SmartRivers tests for is phosphorus. The Total Reactive Phosphorus Index (TRPI) is derived from the differing sensitivities of species to phosphorus. TRPI is scored 0-100 with high scores reflect high diversity and abundance of organisms with high sensitivity to phosphorus, whereas low scores reflect absence of these sensitive species.
The map below shows the locations of SmartRivers samples. Site 1 is above the Chesham STW, Site 2 is the closest site below, Site 3 is on the Little Chess the ‘clean’ channel, and Sites 4, 5 and 6 are further downstream.
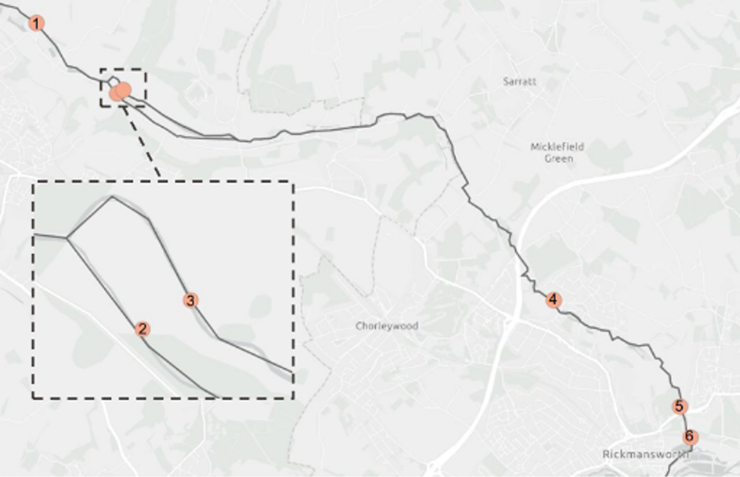
Figure 8 – Map of SmartRivers locations on the Chess. Credit: WildFish
Figure 9 shows the TRPI scores in Spring. There is a very slight increase from 2024 to 2025 in the downstream sites (2, 4, 5, 6) but this is marginal and also reflected in a background increase at site 3 on the Little Chess, making attribution to the phosphorus stripping inconclusive.
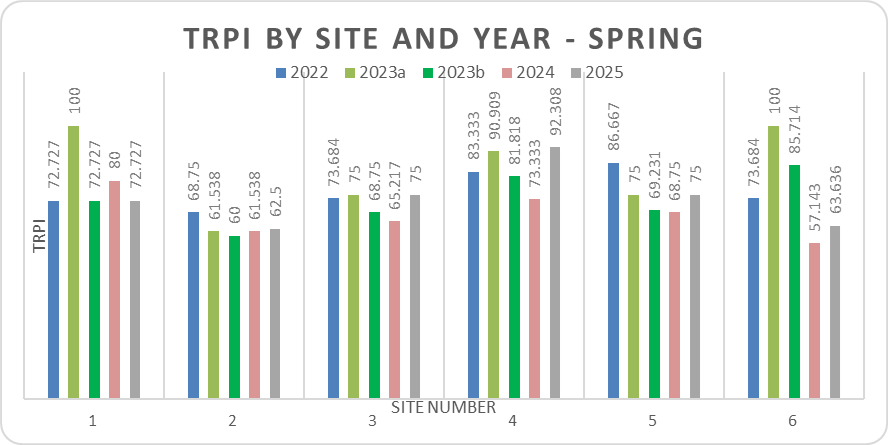
Figure 9 – TRPI scores from Spring SmartRivers surveys 2022-2025. Credit: Iona McMillan, Chilterns Chalk Streams Project
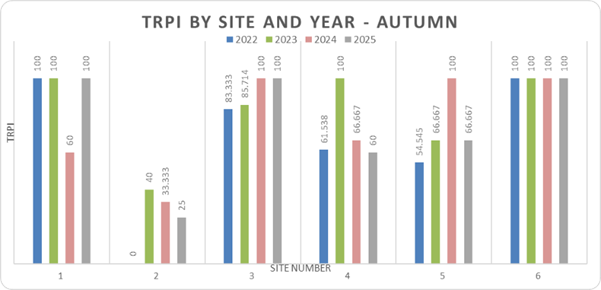
The Autumn TRPI scores shown below in Figure 10 actually decrease between 2024 and 2025 in the downstream sites. At site 2, the closest to the Chesham STW, TRPI score drops from 33 to 25. In comparison the control site on the Little Chess keeps a high score of 100.

Figure 10 – TRPI scores from Spring SmartRivers surveys 2022-2025. Credit: Iona McMillan, Chilterns Chalk Streams Project
To enable comparison between TRPI and phosphate readings, we included sites 2 and 3 within our NOSES samples. At site 2 on the Main Chess post STW, mean phosphate was 0.05mg/l PO4-P, whereas at site 3 on the Little Chess, the mean was marginally higher at 0.06 mg/l PO4-P.
This suggests a lag time in ecological response, as the TRPI scores of 25 versus 100 suggest that whilst actual phosphate levels have significantly reduced in the Main Chess to the point of being indistinguishable from the Little Chess, phosphate sensitive organisms have not yet recovered. This lag time is not unexpected, as species take time to recolonise and increase abundance. In conversations with WildFish about this, they have suggested it can take 1-2 years after phosphate reductions to begin to see improvements in TRPI scores. We will continue to track the TRPI scores to make sure that the predicted improvement in aquatic ecology is happening.
Conclusions
The signs are looking promising in the first year since the phosphorus stripping was put in place at Chesham STW. There has been a significant reduction in the phosphorus level in effluent, and this is reflected in reduced phosphate levels in the River Chess which have returned it to background levels. However, there is not yet an evident recovery in the aquatic invertebrate community. Therefore, we will continue monitoring to track ecological response, and to ensure that phosphate levels remain low and to identify other sources of phosphate pollution.
If you have any questions or would like to get involved in NOSES, SmartRivers, or other citizen science surveys, please email chesscs@chilterns.org.uk.